

Prometheus Setup
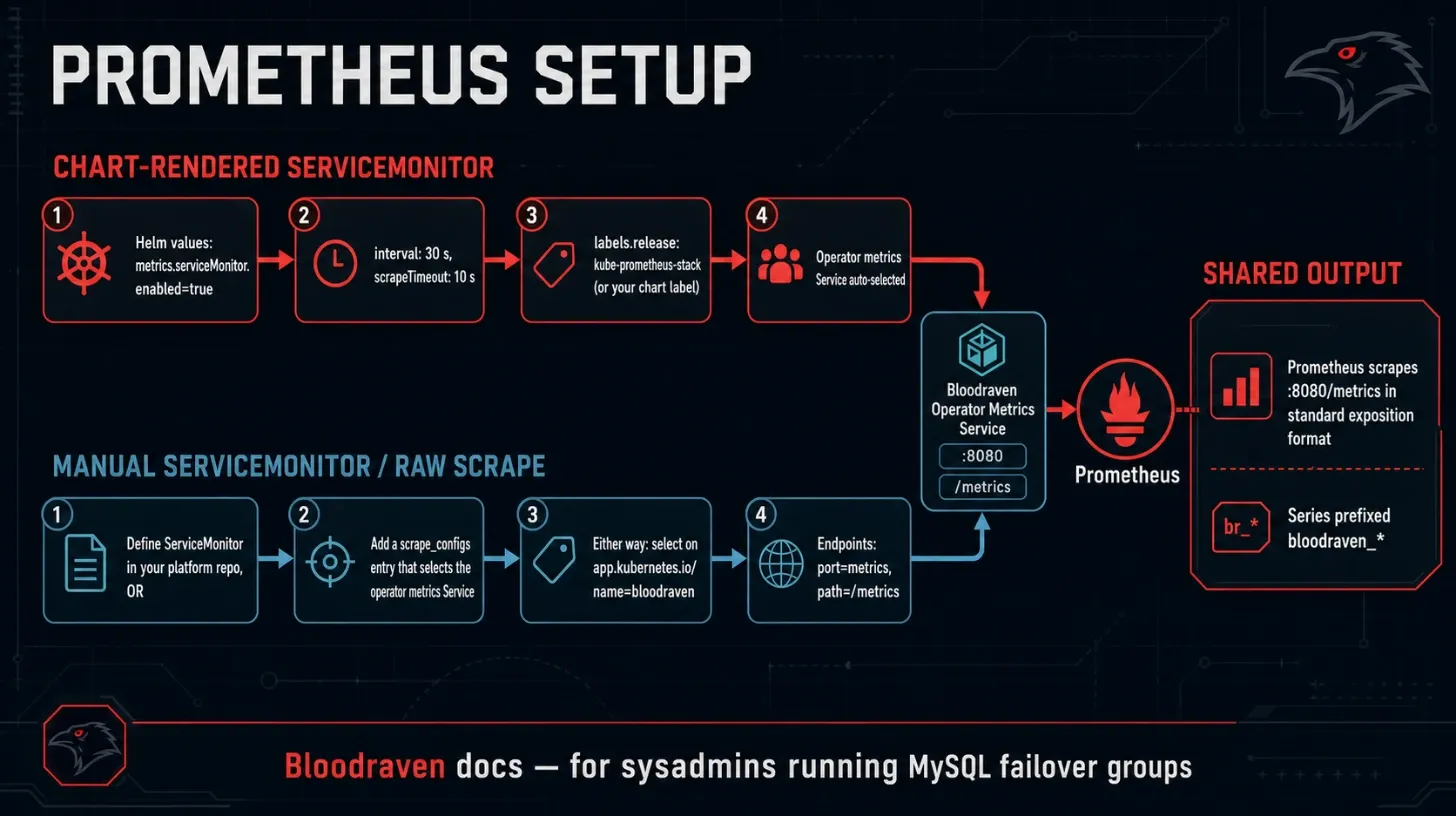
Bloodraven exposes Prometheus metrics on the operator metrics Service, port 8080 named metrics.
Helm values
Deployment coordination adds active/age gauges and grant, expiry, revocation, and planned-deferral counters. Their exact names and labels are in the Deployment API metric reference. Keep revocation and fencing alerts active during application maintenance; a hold is not permission to suppress an emergency failover alert.
metrics:
  service:
    enabled: true
  serviceMonitor:
    enabled: true
    interval: 30s
    scrapeTimeout: 10s
    labels:
      release: kube-prometheus-stack
helm upgrade --install bloodraven bloodraven/bloodraven \
  --namespace bloodraven \
  --create-namespace \
  --values bloodraven-values.yaml
ServiceMonitor
The chart renders a ServiceMonitor when metrics.serviceMonitor.enabled=true. It selects the operator metrics Service in the release namespace.
If you manage the monitor yourself:
apiVersion: monitoring.coreos.com/v1
kind: ServiceMonitor
metadata:
  name: bloodraven
  namespace: bloodraven
  labels:
    release: kube-prometheus-stack
spec:
  namespaceSelector:
    matchNames:
      - bloodraven
  selector:
    matchLabels:
      app.kubernetes.io/name: bloodraven
  endpoints:
    - port: metrics
      interval: 30s
      scrapeTimeout: 10s
Plain Prometheus scrape config
scrape_configs:
  - job_name: bloodraven
    kubernetes_sd_configs:
      - role: endpoints
        namespaces:
          names:
            - bloodraven
    relabel_configs:
      - source_labels: [__meta_kubernetes_service_label_app_kubernetes_io_name]
        action: keep
        regex: bloodraven
      - source_labels: [__meta_kubernetes_endpoint_port_name]
        action: keep
        regex: metrics
Verify targets
kubectl get service -n bloodraven
kubectl get servicemonitor -n bloodraven
kubectl port-forward -n bloodraven deploy/bloodraven 8080:8080
curl http://localhost:8080/metrics | grep '^bloodraven_'
In Prometheus, check Status > Targets for the bloodraven job or ServiceMonitor-generated target.
Reader and source-convergence monitoring
bloodraven_replication_source_state{namespace,group,site,state} is a state-set
gauge for every follower. The namespace and group labels keep identically
named sites in different failover groups in separate series. It emits the
bounded state values converged, pending, and blocked; exactly one is 1
for a follower and the others are 0. Active primaries have no active source
state. Combine it with
bloodraven_replication_running{namespace,group,site,role,thread} and
bloodraven_replication_lag_seconds{namespace,group,site,role} when alerting
on a reader.
Reader failures are deliberately isolated from the failover group's shared
Ready and Degraded conditions. A reader can be unreachable, lagging, or
source-blocked while the core candidate/DR topology remains Ready and not
Degraded. Alert on reader sites by role rather than by site name. For
core RPO (promotable and DR replicas, not designed-to-lag readers):
bloodraven_replication_lag_seconds{role=~"primary-candidate|dr-only"} > 30
The issue-142 form that pages only promotable replicas is:
bloodraven_replication_lag_seconds{role="primary-candidate"} > 30
Alert on a specific reader by namespace, group, and site:
bloodraven_replication_source_state{namespace="warehouse",group="orders",site="reader",state!="converged"} == 1
bloodraven_replication_running{namespace="warehouse",group="orders",site="reader"} == 0
or bloodraven_replication_lag_seconds{namespace="warehouse",group="orders",site="reader"} > 30
To page every role: read-only site under the operator, drop the
identity labels and keep {role="read-only"}.
Use a sustained for interval appropriate to the normal poll and recovery
cadence. A blocked source commonly needs GTID investigation and possibly a
cold reclone; a pending source may clear on a later bounded retry.
License update-period reminder
This is a compliance reminder, not an outage. The operator does not change behavior when the update period ends.
(bloodraven_license_updates_expiry_timestamp_seconds - time()) / 86400 < 30
Alerts
Keep alert rules with your platform monitoring stack. Alert names should link to Alert To Runbook Map, and metric details live in Monitoring Reference.