

Grafana Dashboards
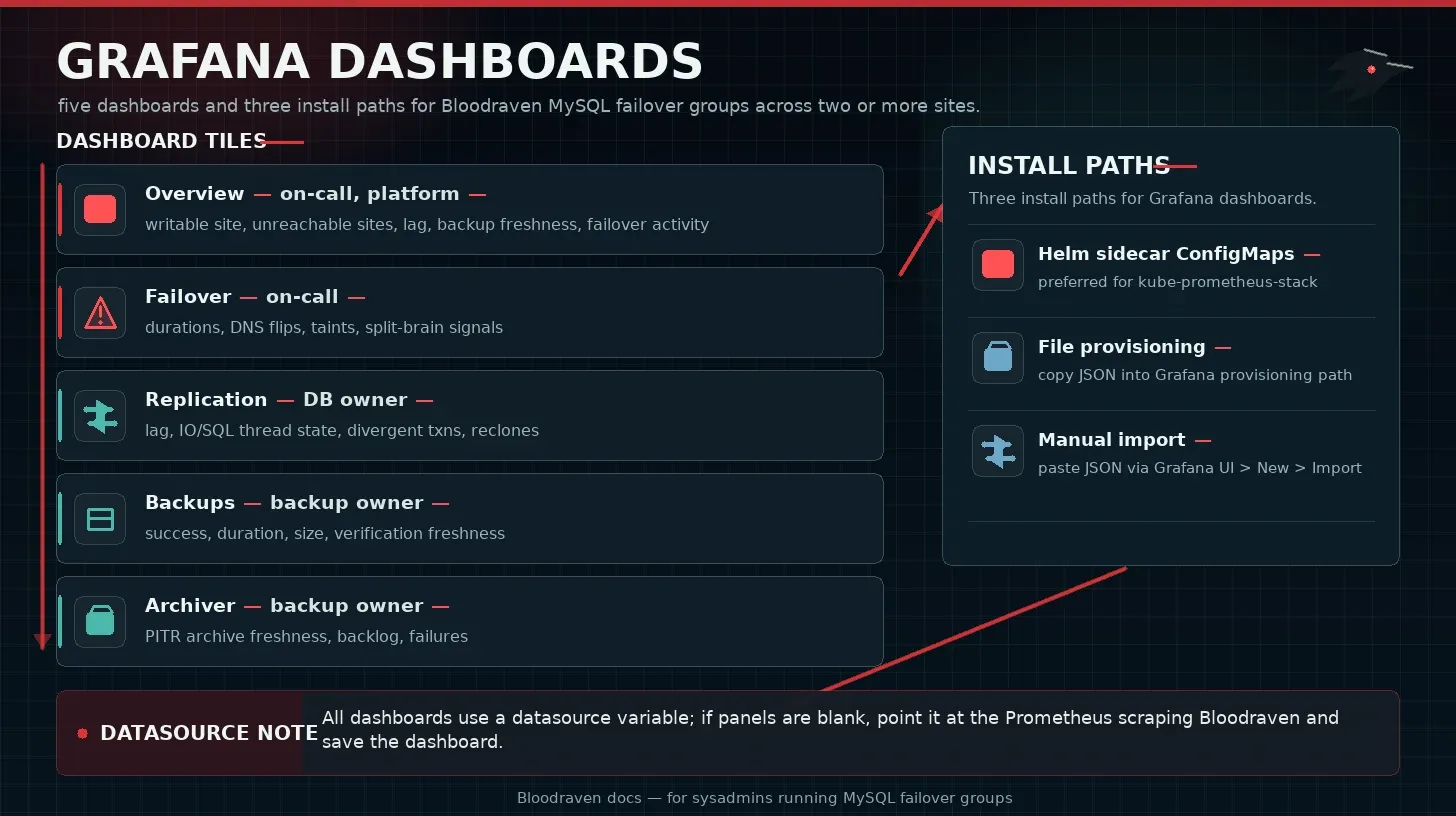
The Helm chart ships five dashboards in charts/bloodraven/dashboards/.
| Dashboard | Audience | Purpose |
|---|---|---|
| Overview | On-call, platform | Writable site, unreachable sites, lag, backup freshness, failover activity |
| Failover | On-call | Failover durations, DNS flips, taints, split-brain signals, deployment leases and deferrals |
| Replication | Database owner | Lag, IO/SQL thread state, divergent transactions, reclones |
| Backups | Backup owner | Backup success, duration, size, verification freshness |
| Archiver | Backup owner | PITR archive freshness, backlog, failures |
Helm sidecar ConfigMaps
Use this path when Grafana has a dashboard sidecar, as in kube-prometheus-stack.
grafanaDashboards:
  enabled: true
  namespace: monitoring
  label: grafana_dashboard
  labelValue: "1"
  folder: Bloodraven
helm upgrade --install bloodraven bloodraven/bloodraven \
  --namespace bloodraven \
  --values bloodraven-values.yaml
File provisioning
Copy charts/bloodraven/dashboards/*.json into Grafana's provisioning path and configure a provider:
apiVersion: 1
providers:
  - name: bloodraven
    folder: Bloodraven
    type: file
    allowUiUpdates: true
    options:
      path: /var/lib/grafana/dashboards/bloodraven
Manual import
In Grafana, open Dashboards > New > Import, paste each JSON file, and select the Prometheus datasource.
Datasource variable
All dashboards use a datasource variable. If panels show no data, open dashboard settings, confirm the variable points at the Prometheus datasource scraping Bloodraven, and save the dashboard.
Troubleshooting
Deployment coordination panels
The Failover dashboard (bloodraven-failover) includes these panels:
| Panel | Query source | Interpretation |
|---|---|---|
| Active deployment leases | bloodraven_deploy_leases_active by group/kind | A running deployment normally holds migration and failover-hold leases; release, expiry, or revocation ends their effect. No series can mean no observations yet, not proof of zero activity. |
| Deployment lease revocations per hour | Hourly increase of bloodraven_deploy_lease_revocations_total by group/kind/reason | A spike means affected deployments lost authority. Correlate topology changes or administrative revocation with the application's DDL boundary. |
| Planned failover deferrals per hour | Hourly increase of bloodraven_planned_failovers_deferred_total by group/reason | DeploymentHold is expected during a deployment that overlaps requested maintenance; it does not block emergency failover. |
These panels use the datasource and group variables. Their source metrics
do not carry namespace/site labels, so the ns and site variables do not
directly filter them; same-named groups in different namespaces cannot be
separated. No recording rules are needed. Use deployment coordination operations
for intervention; do not suppress revocation or fencing signals during maintenance.
| Symptom | Check |
|---|---|
| No data | Prometheus target up, datasource variable, time range |
| Wrong datasource | Dashboard variable default and folder provisioning |
| Sidecar did not import | ConfigMap namespace, grafana_dashboard label, sidecar namespace scope |
| Stale dashboards | ConfigMap updated, Grafana sidecar logs, dashboard uid stable |